Economic Equality Caucus
which advocates for economic equality across the USA.
| Home | Organizational Structure | State Coordinators | Executive Director | Caucus Articles | Memberships | |||||
| "Delta Vision, Delta Voices" | ||||||||||
|
Help Advocate for Economic Progress and Equality. Donate to the Delta Caucus/Economic Equality Caucus. |
||||||||||
Delta Grassroots Caucus Events

Credit Michael Hibblen/ KUAR News, Arkansas Public Radio; Former President Bill Clinton speaking to the Delta Grassroots Caucus on May 2, 2013, at the University of Arkansas Clinton School of Public Service, Little Rock

U. S. Senator John Boozman, Arkansas, at a Delta Grassroots Caucus meeting at the US Capitol
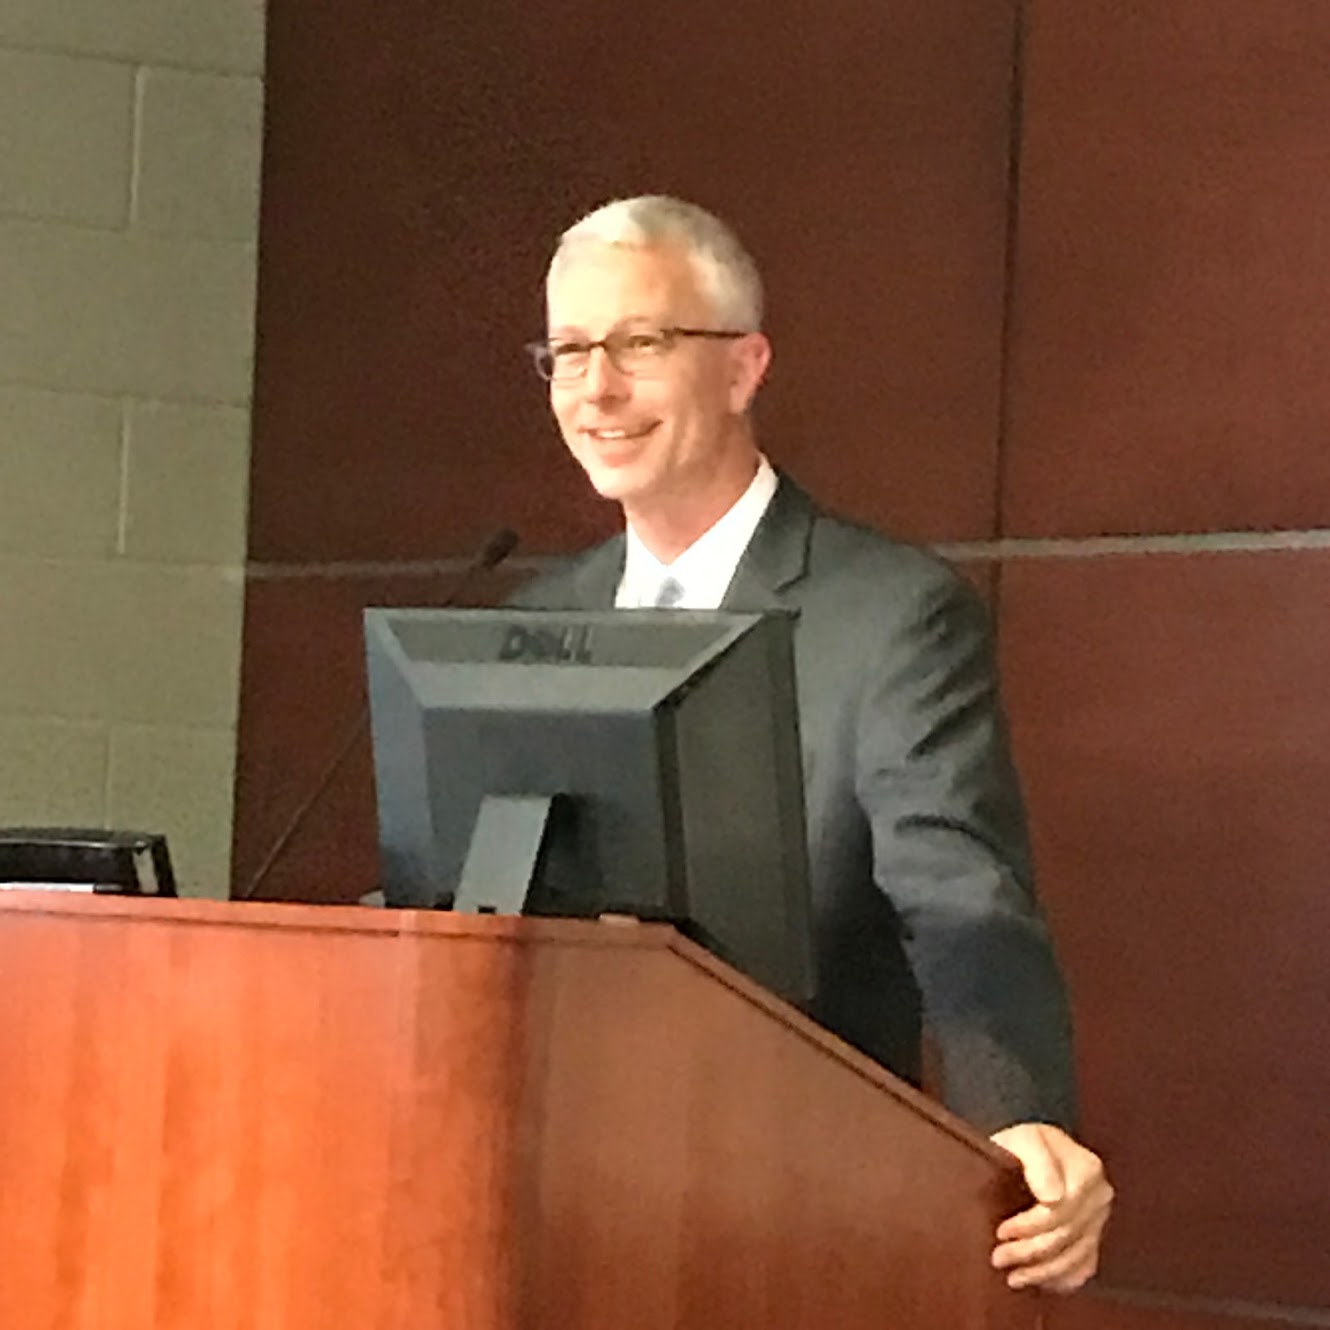
Brad Cole, Executive Director of the Municipal League of Illinois; previously a senior aide to former Republican US Sen. Mark Kirk of Illinois, earlier Mayor of Carbondale, Illinois, veteran Delta regional advocate, speaking at the Delta regional conference in West Memphis, Arkansas on April 26, 2019.

President Bill Clinton makes a comment to Delta Caucus Director Lee Powell at a meeting in Blytheville, Arkansas (in the northeast Arkansas Delta) on Nov. 2, 2014

The Delta Caucus would like to pay tribute to the late, great U.S. Sen. Thad Cochran of Mississippi, a powerful force in the US Senate for decades and a champion for the Delta. Sen. Cochran passed away on May 30, 2019. He spoke to the Delta Caucus on many occasions over the years (he is pictured above speaking to a Caucus event on Capitol Hill in Washington, DC) and his thoughtful, courteous and bipartisan leadership will be sorely missed.
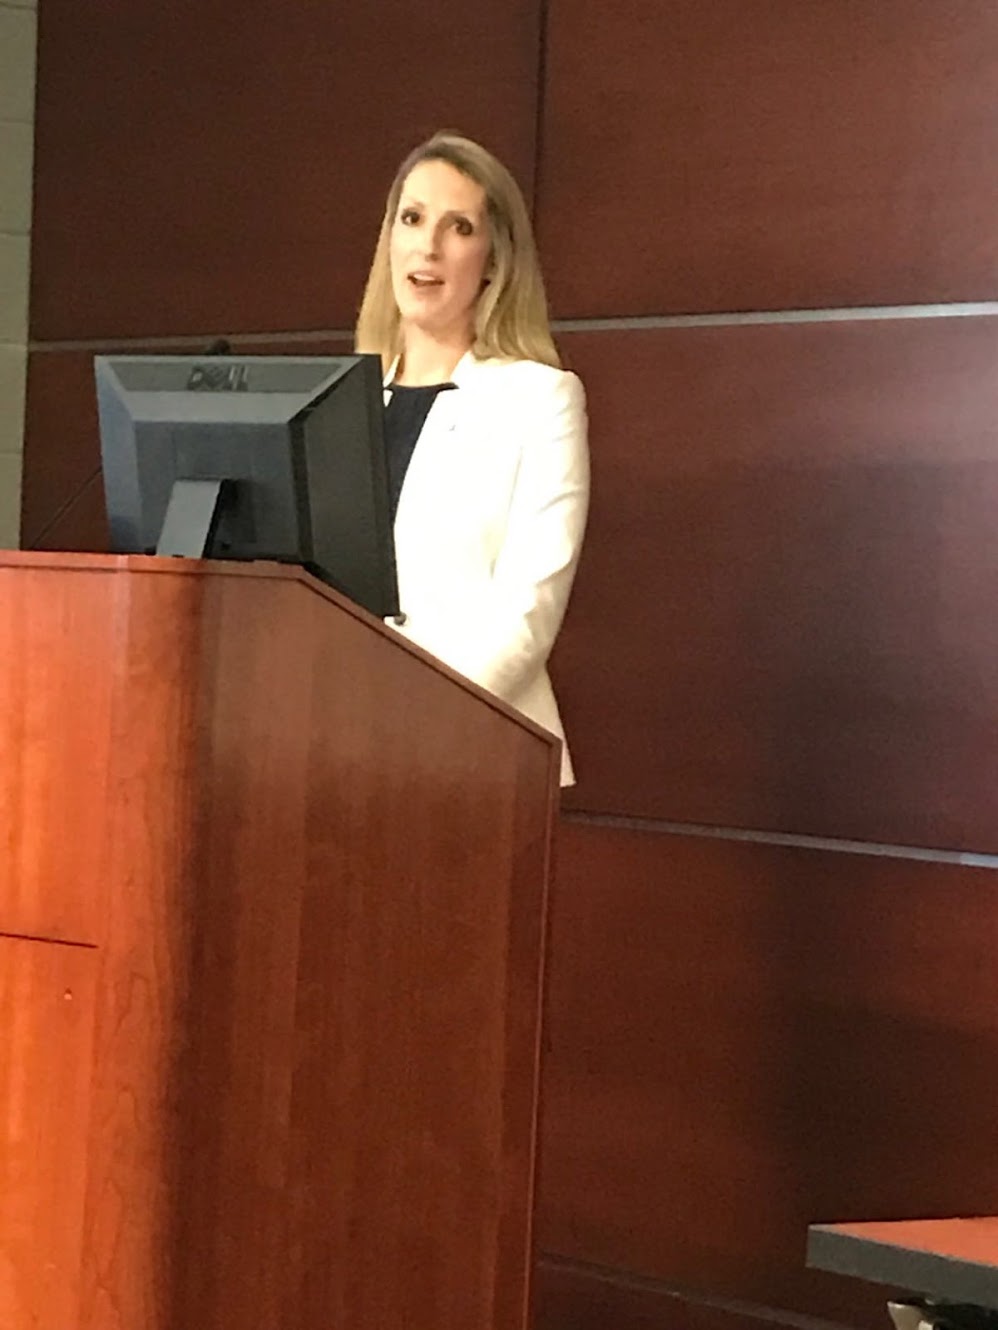
Marcie Lawson, Executive Director, Sikeston, Missouri Regional Chamber and Area Economic Development Corporation, speaking at the Delta regional conference in West Memphis, Arkansas on April 26, 2019.

Alan Gumbel, Greater Memphis Alliance for a Competitive Workforce, Memphis, Tennessee, speaking at the Delta regional conference in West Memphis, Arkansas on April 26, 2019.
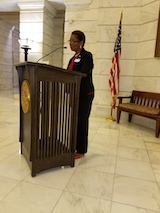
Mayor Shirley Washington of Pine Bluff, AR, speaking to the Delta Caucus at the Arkansas Capitol Rotunda in 2017.
Education, Hunger and Poverty Data for the Delta, November, 2021; and Delta Zoom Link for Nov. 18-19 Delta Zoom Meeting
Posted on November 09, 2021 at 10:36 AM
Nov. 9, 2021 Contact: Lee Powell, Delta Caucus Director (202) 360-6347
Delta States’ Rankings in Education, Poverty and Hunger; and Data on Constructive Impact of Safety Net Initiatives
Executive Summary
The Delta Caucus in 2021 looks back on the past 20 years of advocacy with mixed assessments—we have preserved some constructive programs, created some others, and many community and economic development initiatives are constructive and sustainable. In 2001 we formed the DGC in its current form to continue economic development activities in the 1990s and 2000.
On the negative side, education and poverty data lag far behind most other states: the Delta states continued their historically low rankings in most educational attainment categories such as high school and college graduation, albeit with some relative improvement in literacy rates. The Delta states continue to rank at or near the bottom in poverty levels.
The overall picture in the Delta is not all “gloom and doom”: Programs like the Delta Regional Authority, SNAP and other nutrition policies, Medicaid expansion, education/workforce development, and infrastructure improvements were beneficial, although much remains to be done.
The recently passed $1 trillion infrastructure is much needed and beneficial.
Please register for the Nov. 18-19 Delta Zoom Conference by the link below. Opening session is Thursday Nov. 18 from 4:50 p.m. to 6:50 p.m. and Friday Nov. 19 session is 9 a.m. to 1 p.m.
You will need to highlight, copy and paste this link—it is not a direct link:
https://us06web.zoom.us/meeting/register/tZIuf-yqqjksHdGY-fvE5GtJ05zdyI7TbnU2
Pluses and Minuses in the Delta’s Journey as of 2021
• Job creation and retention at good wages: “Jobs are the best anti-poverty program.” This is the cornerstone for all the other issues and is directly or partly related to all of them. Federal and state job creation funding in conjunction with the private sector needs steady expansion across the region.
• Poverty rates remain far too high: Mississippi (19.6%) and Louisiana (19.0%) ranked at the bottom, and Kentucky, Arkansas, Alabama and Tennessee ranked in the lowest 9 states.
• The Delta Regional Authority is now permanently and soundly established, after having been created in late 2000 after an arduous period of advocacy against opposition from status-quo oriented forces over the previous two decades.
– DRA supporters blocked repeated efforts to abolish the agency or slash its budget over the past 20 years, and while we must work to expand the modest $28 million budget, the DRA still does constructive community and economic development projects in all 8 states each year to supplement the larger-scale federal and state programs.
Education/workforce development improvements: There is now a strong consensus for the fundamental importance of developing a well-educated, well-trained workforce, with K-12, universities and colleges, private sector, federal and state governments steadily strengthening their efforts to improve educational opportunity. However, we know that our educational rankings remain relatively low and much remains to be done.
• Delta ranks at the bottom in percentage of college graduates: five of the six states with the lowest percentage of college graduates are in the Delta, and 6 of the lowest 10 are in the region.
• Delta ranks very low in high school graduates: 6 of the 11 states with the lowest percentage if high school graduates are in the Delta. The Southwest Border is the only region that is slightly lower.
• Lack of basic literacy skills data show gradual improvement: Mississippi and Louisiana were the worst ranking Delta states in a tie for 10th highest at 16%, with Alabama at 12th, Arkansas 14th, Tennessee 17th and Kentucky at 22nd, ranging from Alabama’s 14.8% to Kentucky’s 12.2%. This is in keeping with a national gradual trend toward higher basic literacy skills.
Health care and nutrition for underserved populations: the Delta continues to have too many underserved areas and high levels of obesity, diabetes, heart disease and other maladies.
On the positive side, Medicaid expansion has substantially increased health insurance coverage for lower income people across the region.
• Hunger and nutrition: the Delta continues to rank at or near the bottom in food insecurity, with high levels of nutrition-related health problems. SNAP levels have continually reduced poverty and hunger in the region in conjunction with WIC, school meals and other initiatives.
• Federal cash infusion and food benefits prevented mass starvation: in January, 2021 there were 1,029.000 people in the heartland Delta states of Arkansas, Louisiana and Mississippi who did not have enough food in a seven-day period, according to Census Pulse data, but after the federal aid in the first half of the year that was reduced to 684,000 by August, 2021, preventing hunger for 345,000 people.
• SNAP benefit levels received historic increase: SNAP benefits will increase by about 25 percent—an average of $36.24 per person each month, or $1.19 per day. Although relatively modest, this represents the single largest permanent increase in SNAP benefits in the program’s history.
• Fresh, nutritious produce and limited resource farmer initiatives need to be supported and expanded: Farmers’ markets, farm-to-school, innovative projects like the in-door greenhouse produce initiative of Johnny Pettis and Anita Brown in southeast Arkansas, and many other direct marketing initiatives enhance access of lower-income people to fresh, nutritious produce, create jobs, and aid our minority and limited resource farmers and other producers.
Infrastructure improvements: There have been transportation, housing, broadband, water, and other infrastructure improvements to improve the deteriorating infrastructure in the region, although many more are needed. The recent federal infrastructure package of $1 trillion for transportation, broadband and utilities is a substantial plus for this progress.
Delta heritage tourism in natural resources and cultural and historical contributions: The region is blessed with great cultural and natural resources that are a source of wealth in many ways, bringing in tourist dollars while educating people about the Delta’s great heritage.
Civil rights and diversity: With our diverse region of substantial African American and white populations, a growing Hispanic contingent and other minorities, we must always keep racial, social and gender equity at the forefront in all of our activities.
The Supplemental Poverty Measure (SPM) takes into account the key fact that safety net programs substantially reduce hunger and poverty.
–Social Security moved 26.5 million people out of poverty.
–Stimulus payment in the pandemic relief package moved 11.7 million people out of poverty.
–The expanded unemployment insurance benefits prevented 5.5 million people from falling below the poverty line.
## Data on Selected Education, Hunger and Poverty Indicators November, 2021
The most relevant state statistics are for Arkansas, Mississippi, Louisiana, because these are the states with the Delta areas making up the largest percentage of the state’s population.
Tennessee and Kentucky are also generally similar to Arkansas, Mississippi and Louisiana in economic data, because the western Delta areas of their states are economically distressed, but so are the eastern areas of those states that are located in the relatively impoverished Appalachian region. Therefore Tennessee and Kentucky figures are included in some of the data cited.
State statistics are least useful for Missouri and Illinois, because their Delta areas make up much smaller percentages of their states’ populations, and the northern and central parts of those states in most areas are not as economically distressed areas are.
The Delta has a diverse population with a substantial African American and white population, the Southwest Border has a substantial Hispanic population in addition to other ethnic groups, and Appalachia is predominantly white. The Appalachian case reminds us that many of the nation’s poor people are white, so while minorities have higher poverty rates, this is a problem with an impact on all demographic groups.
The national averages for educational attainment and poverty rank below average for higher-income countries. So the Delta lags behind the national averages that are lower than most other higher-income countries.
I. Percentage of population with college bachelor’s degrees:
The national figures for college graduates in 2019 was 36% of the population.
It needs to be recognized that the national figures for college graduates have declined in the United States markedly in the past 40 years, when the USA ranked highest in the world. Today the United States is ranked seventh, tied with Norway.
Statistics have been rising in recent years and some of the latest estimates put it at over 40%. For some of these categories more recent data was not available so we mostly use the 2019 figures for comparison.
5 of the 6 states with the lowest percentage of college graduates are in the Delta, and 6 of the 10 lowest are Delta states
- West Virginia: 21.05%
- Mississippi: 22.31%
- Arkansas: 23.34%
- Louisiana: 24.98%
- Kentucky: 25.13%
- Alabama: 26.35%
- Indiana: 26.94%
- New Mexico: 27.67%
- Tennessee: 28.72%
- Ohio: 29.28%
All 10 of the states with the lowest percentage of college graduates are in the three regions with the highest rates of poverty, particularly poverty in rural and small-town areas: the Greater Mississippi Delta, Appalachia, and the Southwest Border.
The Delta with its substantial African American population and the Southwest Border with its large Hispanic population have substantial percentages of minorities in their demographic make-up. Appalachia is a predominantly white region.
II. Percentage of population with high school diplomas, lowest ranking states:
Percentage of the national population with high school diplomas in 2020 was 91% according to some calculations, but as low as 81% in others such as the OECD.
6 of the 11 states with the lowest percentage of high school graduates are in the Greater Delta:
- California: 84.03%
- Texas: 84.65%
- Mississippi: 85.30%
- New Mexico: 85.88%
- Louisiana: 85.96%
- Nevada: 86.85%
- Alabama: 87.11%
- Kentucky: 87.19%
- Arkansas: 87.48%
- Arizona: 87.60%
- Tennessee: 88.01%
III. Percentage of population lacking basic literacy skills
In those lacking literacy skills the regional figures are substantially behind the national averages, but not as low as in the high school and college diploma categories.
Mississippi (tied for 10th highest) 16% Louisiana (tied for 10th highest) 16%
Alabama, 12th highest 14.8%
Arkansas, 14th highest 13.7%
Tennessee. 17th highest 13.2%
Kentucky, 22nd highest 12.2%
IV. Poverty rankings in the Delta
These are included because poorer areas have fewer resources to put into their schools. This obviously has an impact on the educational quality of high schools and colleges, which these figures don’t assess. In any case, the quality issue is very difficult to quantify.
NOTE: Some other rankings place California as the poorest state. These are based on US Census Bureau figures in 2019.
The national average for the USA is 10.8%
States (and Puerto Rico) with the 10 highest poverty levels:
- Puerto Rico 43.5%
- Mississippi 19.6%
- Louisiana 19.0%
- New Mexico 18.2%
- Kentucky 16.3%
- Arkansas 16.2%
- Alabama 15.5%
- Oklahoma 15.2%
- Tennessee 13.9%
- South Carolina 13.8%
V. Constructive impact of stimulus, SNAP, Social Security and other safety net programs in the Delta and nation-wide
The Mississippi Delta Region still has high rates of hunger, food insecurity, poverty, obesity, and diet-related diseases, despite some important projects that have begun to address one or more of those challenges, and despite the very positive impact of recent boost to the federal safety net.
These figures demonstrate a fundamental fact: the safety net programs have reduced hunger and poverty in the Delta and across the country. Without these programs, hunger and poverty would be far worse.
Data below focuses on Mississippi, Arkansas and Louisiana as representing the heart of the Delta, with the largest populations in their Delta areas of each state.
More recent Census Pulse data indicates how many Americans didn’t have enough food in one seven-day period.
January 2021 August 2021
MS 260,825 215,163 LA 525,150 265,460 AR 243,887 204,790
USA 23.8 million 16.7 million
The results prove that the large infusion of federal food benefits assistance and cash in the first half of 2021 dramatically reduced hunger nationwide and in each of the three states, but that hunger is still at high levels.
SNAP’s (Supplemental Nutrition Assistance Program, formerly known as food stamps) Positive Impact
SNAP Participation, By People and Benefits Amounts, 2020 v 2021, According to USDA
May 2020 People
MS 471,453
LA 845,228
AR 387,379
May 2020 Benefits
MS $84,3 million
LA $153.7 million
AR $69.9 million
May 2021 People
MS 411,430
LA 857,954
AR 333,362
May 2021 Benefits
MS $94.1 million
LA $198.7 million
AR $73.8 million
In Mississippi, Louisiana, and Arkansas alone, SNAP will spend an estimated $3.65 billion – yes “billion” with a b – dwarfing all the charitable assistance over the next year.
Safety net programs prevented mass starvation during the pandemic: While tens of millions of Americans faced serious food hardships during the pandemic, the nation – and the Delta - avoided mass starvation (such as Ethiopia and North Korea suffer) precisely because of these massive federal food supports – combined with large infusions of federal cash into households – enabled families to obtain and afford more food.
Beneficial impact of programs assisting low-income families—Supplemental Poverty Measure takes their impact into account
In the past decade the U.S. Census Bureau began publishing the Supplemental Poverty Measure (SPM), which extends the official poverty measure by taking account of many of the government programs designed to assist low-income families and individuals that are not included in the official poverty measure. The SPM is produced with the support of the Bureau of Labor Statistics (BLS).
Highlights for poverty data in 2020:
• The Supplemental Poverty Measure (SPM) rate for 2020 was 2.3 percentage points lower than the official poverty rate of 11.4 percent. This is the first time in the history of the SPM that poverty was lower using the SPM than the official poverty rate.
• The 2020 SPM rate of 9.1 percent was the lowest rate since estimates were initially published for 2009.
• There were 11 states plus the District of Columbia for which SPM rates were higher than official poverty rates, 30 states with lower rates, and 9 states for which the differences were not statistically significant.
• Social Security continued to be the most important anti-poverty program, moving 26.5 million individuals out of poverty.
• Stimulus payments, enacted as part of economic relief legislation related to the COVID-19 pandemic, moved 11.7 million individuals out of poverty. Unemployment insurance benefits, also expanded during 2020, prevented 5.5 million individuals from falling into poverty.
Back to the top